Data Analysis and Visualization | Bootcamp Training
Data Intelligence | Data Visualization | Data Driven Decision
Data Analysis and Visualization Training is crucial in today’s data-driven world. It empowers individuals and organizations to extract actionable insights from data, aiding better decision-making. This training enhances data literacy, enabling professionals to solve complex problems, identify trends, and communicate findings effectively, thus driving innovation and competitiveness.

In the data-centric landscape of today, the significance of Data Analysis and Visualization Training cannot be overstated. This immense 3 month training equips both individuals and businesses with the skills to extract valuable insights from data, facilitating improved decision-making. It also elevates data literacy, enabling professionals to address intricate challenges, recognize patterns, and convey discoveries proficiently, thereby fostering innovation and competitive advantage.
Data Analysis and Visualization is highly relevant in the real-time world and is applied across various industries for informed decision-making, problem-solving, and innovation. Here's why it's so crucial and some examples of companies that need data analysts:
Relevance:
Informed Decision-Making: Data analysis provides insights that drive strategic decisions. Businesses can understand customer behavior, market trends, and operational efficiency through data, leading to better decision-making.
Competitive Advantage: Companies that can extract meaningful insights from data gain a competitive edge. They can respond to market changes, optimize processes, and innovate more effectively.
Personalization: Data analysis enables businesses to offer personalized services and recommendations to customers. For example, Netflix and Amazon use data to recommend content and products.
Risk Management: In finance, data analysis is essential for risk assessment. Companies like banks and insurance firms rely on data analysts to evaluate financial and market risks.
Healthcare: Medical professionals use data analysis to make diagnoses and treatment plans. Pharmaceutical companies analyze data to develop new drugs and therapies.
Marketing: Marketing teams use data to target specific demographics, measure the success of campaigns, and optimize advertising spending.
Supply Chain Optimization: Companies in logistics and manufacturing use data to optimize supply chains, reduce costs, and ensure timely deliveries.
Predictive Maintenance: Industries like aviation and manufacturing rely on data analysis to predict when equipment will fail, allowing for timely maintenance.
Environmental Sustainability: Data analysis is used to monitor and mitigate environmental issues, such as climate change and resource conservation.
Companies that Need Data Analysts:
Google: Google uses data analysts to analyze user behavior, improve search algorithms, and enhance its advertising platforms.
Amazon: Amazon employs data analysts to optimize its supply chain, personalize recommendations, and improve customer service.
Facebook: Facebook relies on data analysts to understand user engagement, enhance ad targeting, and detect and prevent fraud.
Walmart: Walmart uses data analysis to optimize inventory management, pricing, and supply chain operations.
Apple: Apple utilizes data analysts to gain insights into user preferences, app usage, and product performance.
Uber: Uber relies on data analysis for dynamic pricing, route optimization, and driver-rider matching.
Netflix: Netflix uses data analysts to recommend content to users and make decisions about original content production.
Financial Institutions: Banks, such as JPMorgan Chase and Wells Fargo, employ data analysts for risk management, fraud detection, and customer insights.
Healthcare Providers: Hospitals and healthcare systems use data analysts to improve patient care, manage resources, and predict disease outbreaks.
Retailers: Companies like Target and Macy's use data analysis for inventory management, demand forecasting, and customer analytics.
In essence, data analysis and visualization have become indispensable tools for organizations to remain competitive, efficient, and innovative. As a result, the demand for data analysts continues to grow across industries, making it a highly relevant and sought-after skill.
Our Data Analysis and Visualization Training course is suitable for a wide range of individuals and professionals who want to gain skills in data analysis and visualization. It is ideal for:
Aspiring Data Analysts: Those looking to start a career in data analysis and visualization.
Data Scientists: Individuals seeking to enhance their data analysis and visualization skills.
Business Analysts: Professionals aiming to leverage data for better decision-making.
Data Enthusiasts: Anyone passionate about working with data and deriving insights from it.
Managers and Executives: Leaders who want to make data-informed decisions and understand data reports.
Marketers: Marketers interested in data-driven marketing strategies and analytics.
Statisticians: Statisticians looking to broaden their skills to include data visualization and practical data analysis.
IT Professionals: IT experts who wish to explore data analysis as part of their skill set.
Finance Professionals: Finance experts interested in using data for risk assessment and investment decisions.
Healthcare Professionals: Healthcare workers who want to analyze medical data for better patient care.
Academics and Researchers: Researchers seeking data analysis and visualization skills for academic and research projects.
Entrepreneurs: Business owners who want to use data to grow their businesses and make data-informed decisions.
Job Seekers: Individuals looking to enhance their employability in data-related roles.
Career Changers: People looking to transition into a career that involves data analysis and visualization.
Anyone Interested in Data: Essentially, anyone curious about data and its applications.
These courses are often designed to cater to a broad audience, ranging from beginners with no prior experience to those with some background in data analysis. The curriculum can be adapted to different levels of expertise and specific career goals. Whether you're seeking to advance in your current career, switch careers, or simply explore the world of data, a Data Analysis and Visualization Training course can be a valuable investment in your skills and knowledge.
Module 1: Introduction to Data Analysis, Python, and SQL
Introduction to Data Analysis
- Understanding the importance of data analysis
- Types of data and data sources
- Data analysis workflow
Python Fundamentals
- Python syntax and data types
- Variables, operators, and basic operations
- Control structures (if statements, loops)
Data Handling with Python
- Data structures (lists, dictionaries, tuples)
- Reading and writing data files (CSV, Excel)
- Pandas library for data manipulation
Data Cleaning and Preprocessing with Python
- Identifying and handling missing data
- Removing duplicates and outliers
- Data transformation and normalization
Module 2: Intermediate Python, SQL, and Data Visualization with Python
Intermediate Python
- Functions and modules
- Exception handling
- Working with dates and times
SQL Fundamentals
- Understanding databases and SQL
- Writing SQL queries (SELECT, JOIN, WHERE)
- Database management systems (e.g., SQLite)
Advanced SQL
- Aggregation and grouping in SQL
- Subqueries and table joins
- Indexing and optimization
Data Visualization with Python
- Matplotlib for basic plotting
- Seaborn for statistical visualization
- Customizing and enhancing visualizations
Module 3: Data Visualization with Tableau or Power BI, Advanced Data Analysis, and Final Project
Data Visualization with Tableau or Power BI
- Introduction to the selected tool (Tableau or Power BI)
- Creating interactive dashboards
- Visual storytelling and best practices
Advanced Data Analysis Techniques
- Hypothesis testing and statistical analysis
- Correlation and regression analysis
- Time series analysis
Introduction to Machine Learning
- Machine learning concepts
- Scikit-Learn for building models
- Model evaluation and validation
Capstone Project and Course Conclusion
- Apply your skills to a comprehensive data analysis project
- Create interactive visualizations using Tableau or Power BI
- Present your findings and insights
- Receive feedback and wrap up the course
This course plan covers the basics of data analysis, Python programming, SQL for data retrieval and manipulation, data visualization with Python, and interactive dashboard creation using Tableau or Power BI.
You'll also be introduced to more advanced topics like machine learning and time series analysis, and you'll have the opportunity to work on a capstone project to apply what you've learned.
Training outcomes for our Data Analysis and Visualization program include the following:
Proficiency in Data Analysis: Students should have a strong understanding of data analysis concepts, methodologies, and tools, including data cleaning, exploration, and statistical analysis.
Python and SQL Skills: Graduates should be proficient in using Python for data manipulation, analysis, and visualization, as well as SQL for data retrieval and manipulation.
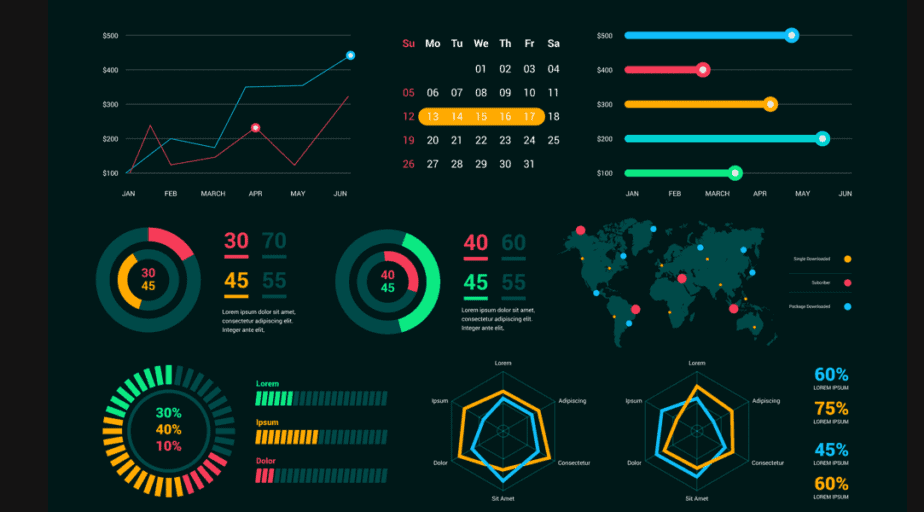
Data Visualization: The ability to create effective and engaging data visualizations using tools like Matplotlib, Seaborn, Tableau, or Power BI.
Problem-Solving Skills: Developing critical thinking and problem-solving abilities when working with data to extract meaningful insights.
Data Storytelling: The capability to communicate findings effectively through data storytelling, making data-driven insights accessible to a broader audience.
Real-World Projects: Completion of real data analysis projects, demonstrating practical skills and the ability to apply knowledge to complex datasets.
Machine Learning Fundamentals: An introduction to machine learning concepts and the ability to build and evaluate simple predictive models.
Data Ethics and Privacy: An understanding of the ethical considerations related to data analysis, including data privacy and responsible data handling.
Certification: Successful participants will receive a certification, acknowledging their completion of the training program.
Portfolio: The creation of a portfolio that showcases the student's data analysis and visualization projects, which can be used when applying for jobs.
Networking: Building a professional network with instructors and peers, which can be valuable for future collaboration and career development.
Career Preparation: Preparing students for careers in data analysis, data science, business intelligence, and related roles, with the ability to apply their skills in real-world settings.
These training outcomes are designed to ensure that participants have the knowledge and skills needed to excel in data analysis and visualization, as well as to make data-driven decisions and contribute effectively in various industries and sectors.
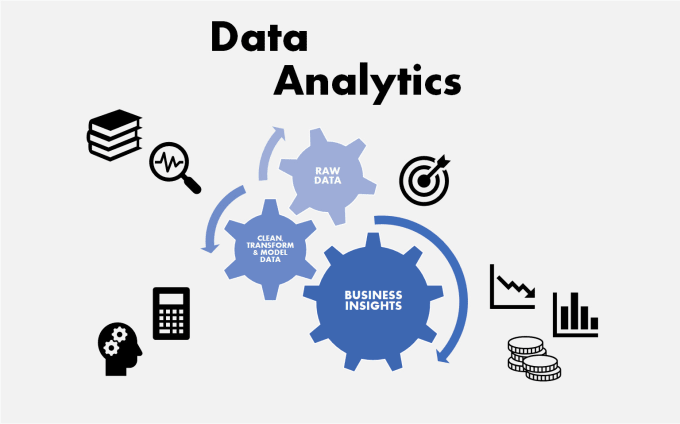
Data analysis is the process of inspecting, cleaning, transforming, and interpreting data to discover insights. Data visualization is the graphical representation of data to make it more understandable.
Data analysis and visualization help organizations make informed decisions, identify trends, and communicate data-driven insights effectively.
Common tools include Python (with libraries like Pandas and Matplotlib), SQL, Tableau, Power BI, Excel, and R.
While not mandatory, programming skills, especially in Python, can significantly enhance your data analysis capabilities.
Bar charts, line charts, scatter plots, pie charts, heatmaps, and interactive dashboards are some common data visualization types.
No, data analysis and visualization are applicable in various fields, including healthcare, finance, academia, marketing, and more.
Data analysis primarily focuses on extracting insights from existing data, while data science encompasses a broader range of tasks, including data collection, machine learning, and predictive modeling.
A typical career path may start as a Data Analyst and progress to roles like Senior Data Analyst, Data Scientist, or Business Intelligence Analyst.
Yes, our training is offered online but we can also offer in class or onsite training based on request and convenience.
Price:
£2400 £1800 + VAT (Discounted Price)
$2900 $2175 + VAT (Discounted Price)
Calender
All our courses are LIVE online classes
Data Analysis and Visualization | Bootcamp Training
Time: 9:00am – 4:00pm (GMT +1)
Weeks: 35 – 40
Total Hours: 300